A/B Test
Glowbox mobile banner
This project is centered around data preprocessing in Python, followed by an A/B test conducted using Python libraries: . The findings are presented below in a comprehensive final report and a short video presentation. See Part 2 here.
Project Logistics
Project Background
The e-commerce company Glowbox specializes in sourcing unique and high-quality prodects from around the world.The company is primarily known amongst its customer base for boutique fashion items and high-end decor products. However, their food and drink offerings have grown tremendously in the last few months, and the company wants to bring awareness to this product category to increase revenue.
The Growth team decided to run an A/B test that highlights key products in the food and drink category as a banner at the top of the website.

Data Preparation
ETL in PostgreSQL: The dataset is stored in bi.io database The three tables were joined and only the necessary columns and rows were extracted on a user level using the query below:

Introduction
The goal of the test was to determine if the treatment had a statistically significant impact on the average spent per user and / or user conversion rate.
Hypothesis
Two hypotheses were formulated for both average spent per user and user conversion rate.
Test Users and Sample Selection
Randomly selected users from the website's traffic were included in the A/B test. Users who have previously participated in an A/B test on the website were excluded. The control group consisted of users who saw the existing website user interface with no banner, while the treatment group consisted of users who saw the updated website user interface with the food and drink banner.
Sample Size Determination
The sample size should be large enough to detect meaningful differences in the metrics being measured. The control group had 24,343 users, the treatment group had 24,600 users, and the total users were 48,943.
Test Duration
The duration of the A/B test depended on the website's traffic and the expected effect size, which resulted in a total of 14 days.
Metrics
The metrics used in the A/B test were average spent per user, measured by mean, and user conversion rate, measured by proportion.
Statistical Method
Two-tailed t-test was used to compare the mean spent per user, and a two-tailed z-test was used to compare the conversion rate of the control and treatment groups. The level of significance (alpha) was set at 0.05 for both tests.
Set-Up
The experiment pertained to the mobile site only. Users saw either the current webpage or the webpage displaying a banner of the food and drink category.
Hypothesis Test - Average Spent Per User
To test the impact of the banner on the average amount spent per user, we conducted a hypothesis test
using a two-tailed T-test to measure the average difference in means between the Control and
Treatment groups. The significance level was set at 0.05 or 5%, and the confidence level was set at
0.95 or 95%.
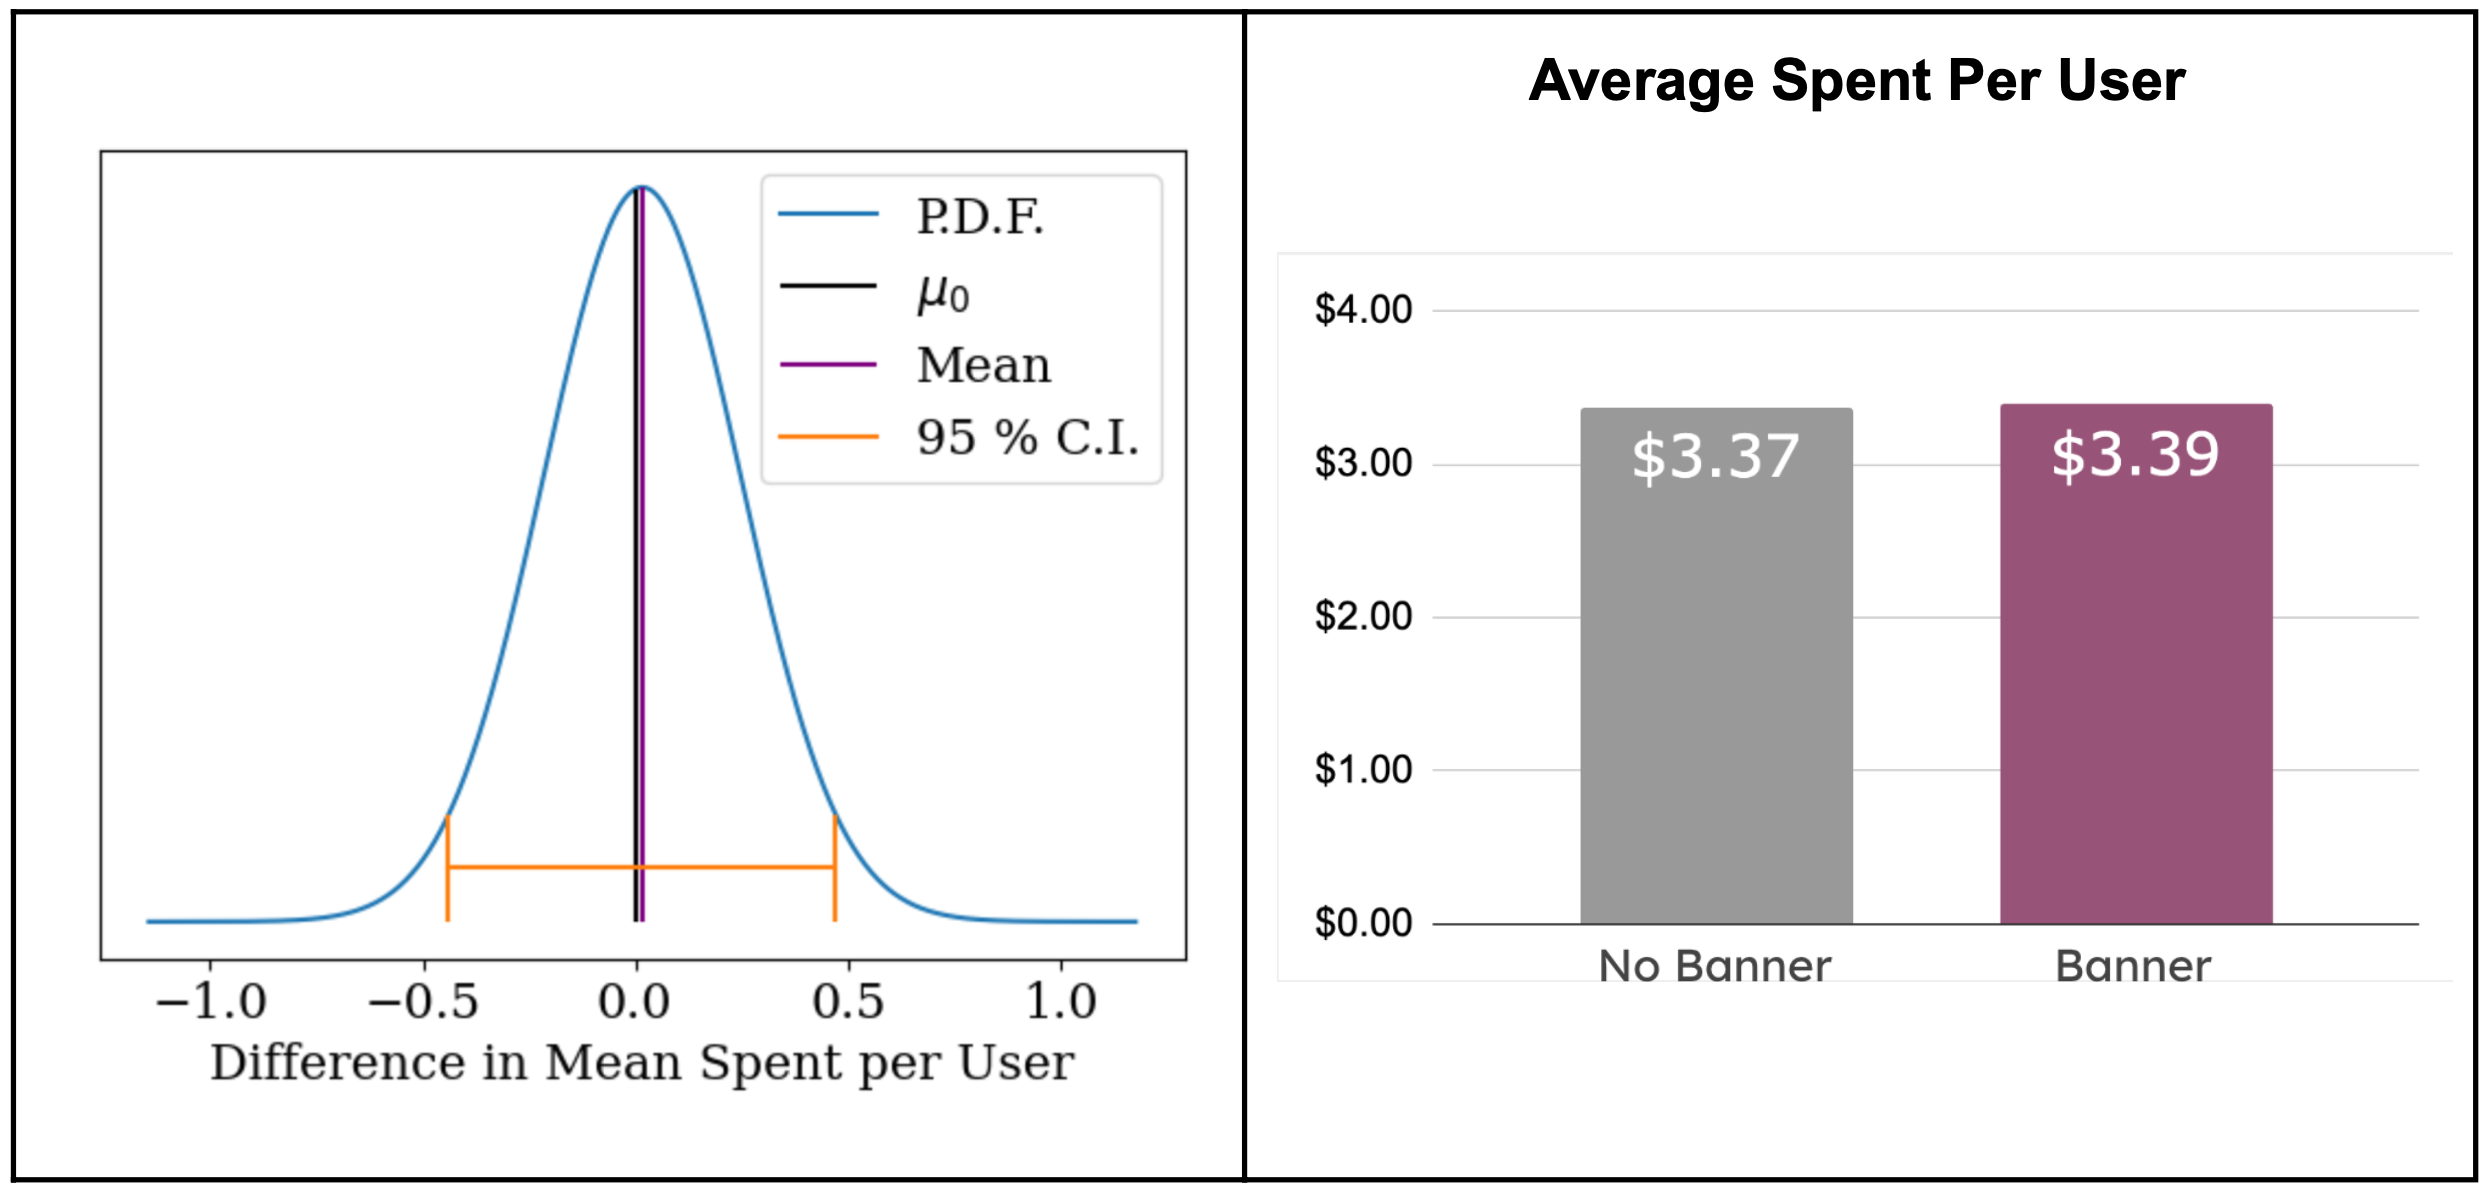
The mean for the Control group was found to be 3.375, with a standard error of 0.166. The
mean
for the Treatment group was 3.391, with a standard error of 0.162.
The critical value was found to be 1.960, and the confidence interval for the difference in
means was calculated to be -0.4386 to 0.4713. The test-statistic was found to be 0.0704.
Based on our analysis, we conclude that the results of the hypothesis test were
statistically
insignificant. Therefore, we fail to reject the null hypothesis that there is no difference in the
mean amount spent per user between the Control and Treatment groups.

Hypothesis Test - Conversion Rate
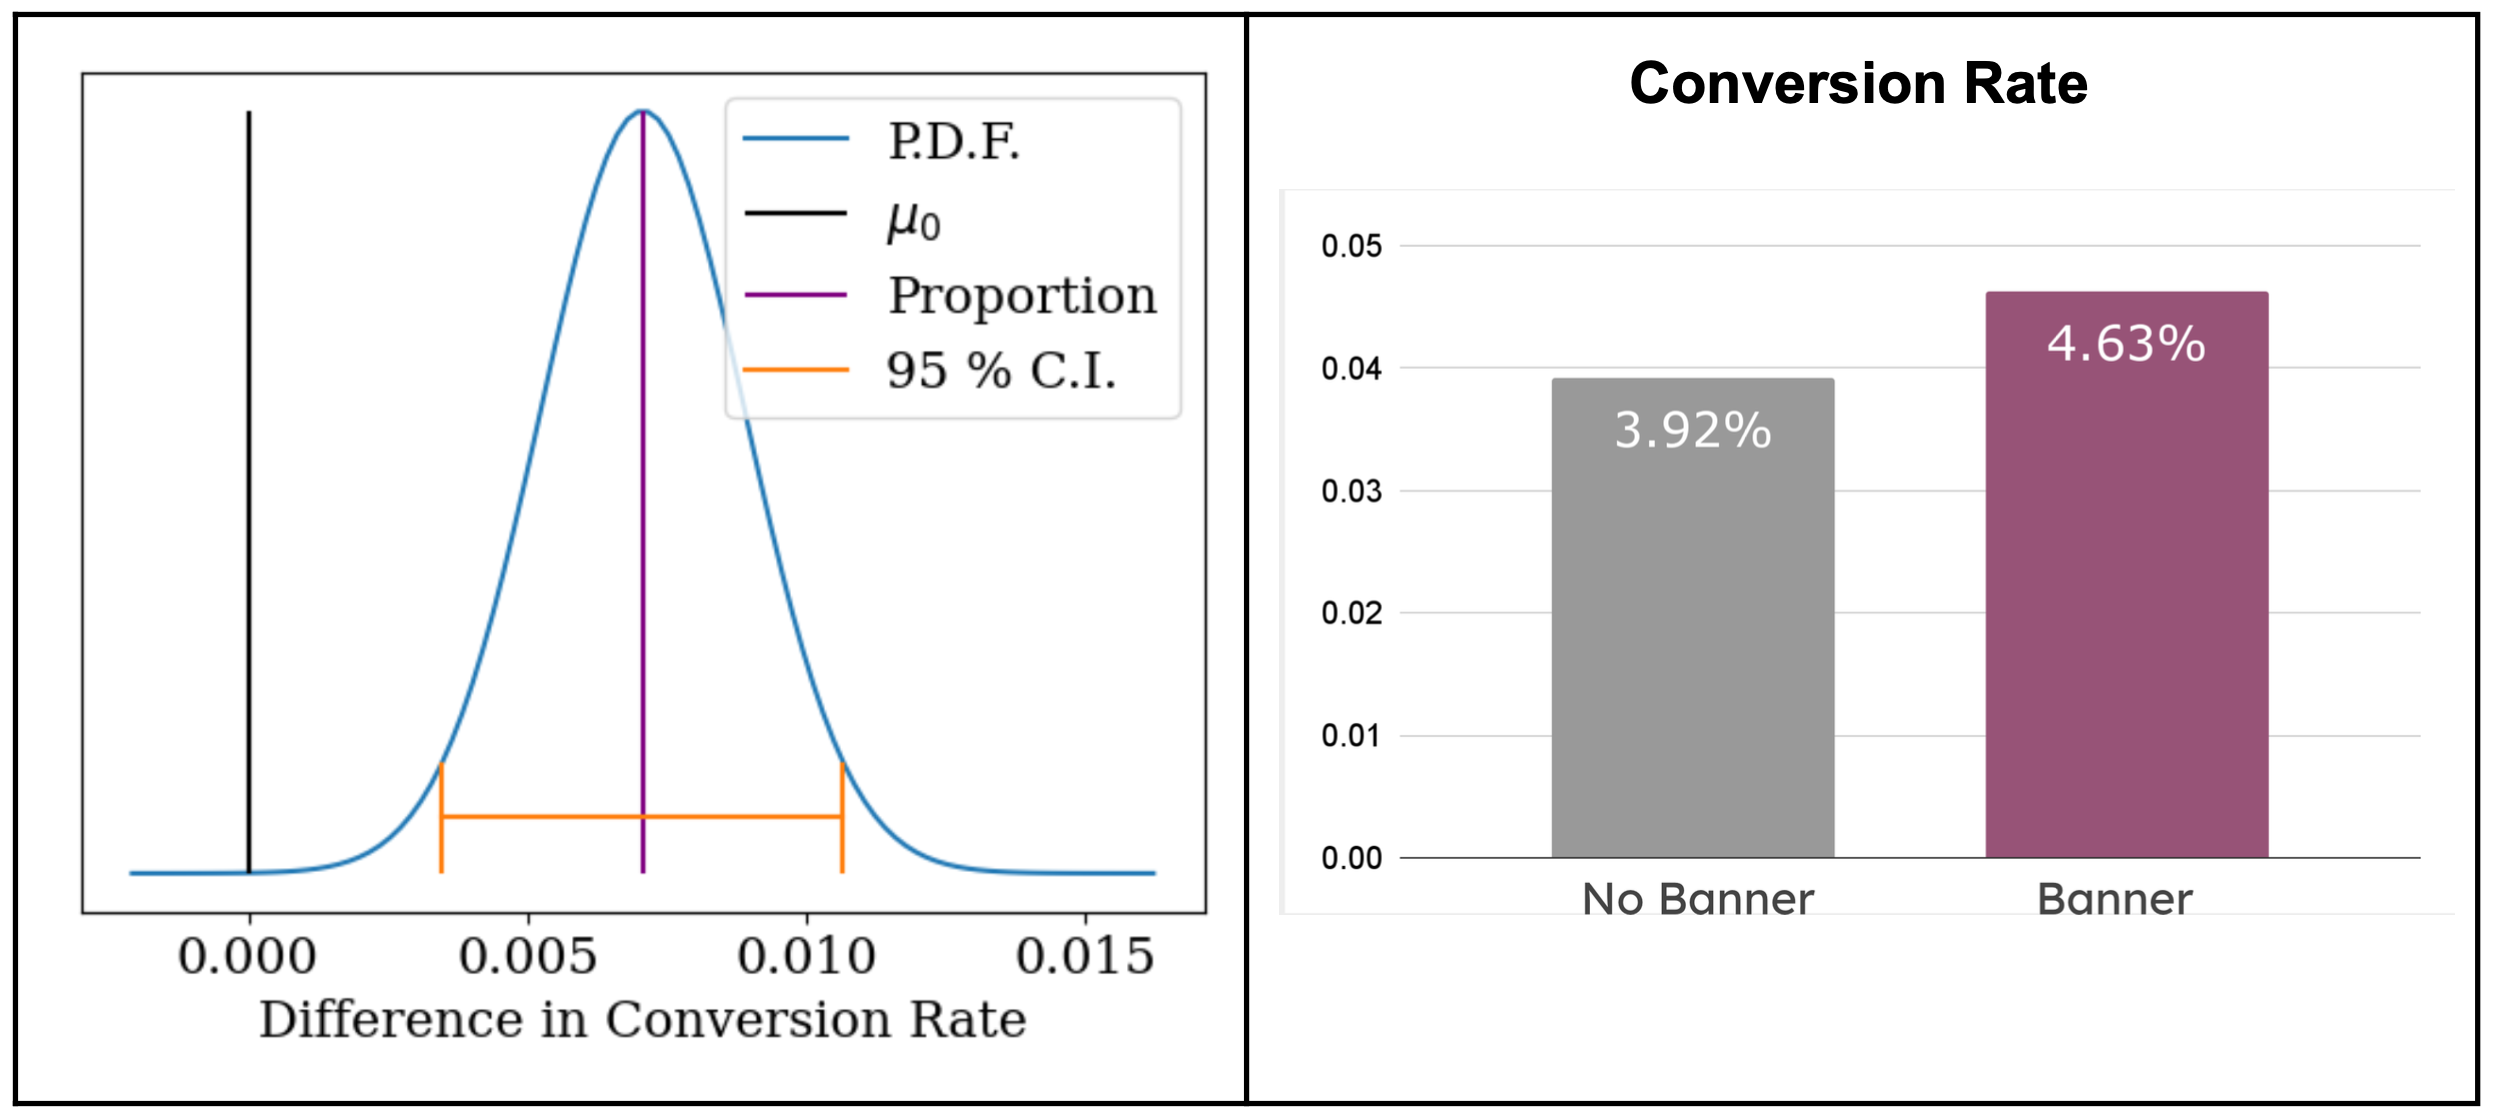
The conversion rate for the Control group was found to be 0.0392 with a standard error of 0.0012, while the conversion rate for the Treatment group was 0.0463 with a standard error of 0.0013. The difference in proportion was 0.007.
The critical value was found to be 1.9600, and the confidence interval for the difference in proportions using the pooled standard error was calculated to be 0.0035 to 0.0107. The pooled proportion test statistic was -3.864, and the proportion p-value was 0.000111.
Based on our analysis, we reject the null hypothesis and conclude that there is a significant difference in conversion rates between the Control and Treatment groups. We used a two-sample two-sided z-interval for a difference in proportions assuming equal proportions, and our results indicate that the Treatment group had a higher conversion rate than the Control group.

Conclusion
In conclusion, the A/B test conducted by the Growth and Engineering teams at Glowbox aimed to
increase revenue and conversion rate by highlighting key products in the food and drink category on
the mobile website. The test involved a control group and a treatment group, and two hypotheses were
formulated for the average spent per user and user conversion rate. The statistical methods used
were two-tailed t-test and z-test, and the level of significance was set at 0.05 for both tests.
The results of the hypothesis test for the average spent per user showed that there was no
statistically significant difference between the Control and Treatment groups. However, for the user
conversion rate, the test indicated a significant difference between the two groups, with the
Treatment group having a higher conversion rate than the Control group.
Based on the findings, the Growth and Engineering teams at Glowbox can conclude that
highlighting the food and drink category on the mobile website had a positive impact on user
conversion rate, but no impact on the average amount spent per user. The teams can use these
findings to make informed decisions and further optimize their mobile website to increase revenue
and improve user experience.
Note: Inferential statistics were performed using Python. For this project I
challenged
myself to code the statistical functions from scratch using the mathematical formulas, as opposed to
relying solely on the scipy.stats library.